

These are some crazy statistics...

The lightest blue areas have less than 10% obesity rates, the next two blue shades represent 10-20% obesity rates. This is where we were in 1991, with no state in the US (which reported data, the white areas didn't report) having greater than 20% obesity.

The purple is 20-25% obesity, followed by red at 25-30% and orange at greater than 30%. Note that only one state in the 2007-2009 timeframe, Colorado, is in the blue range.
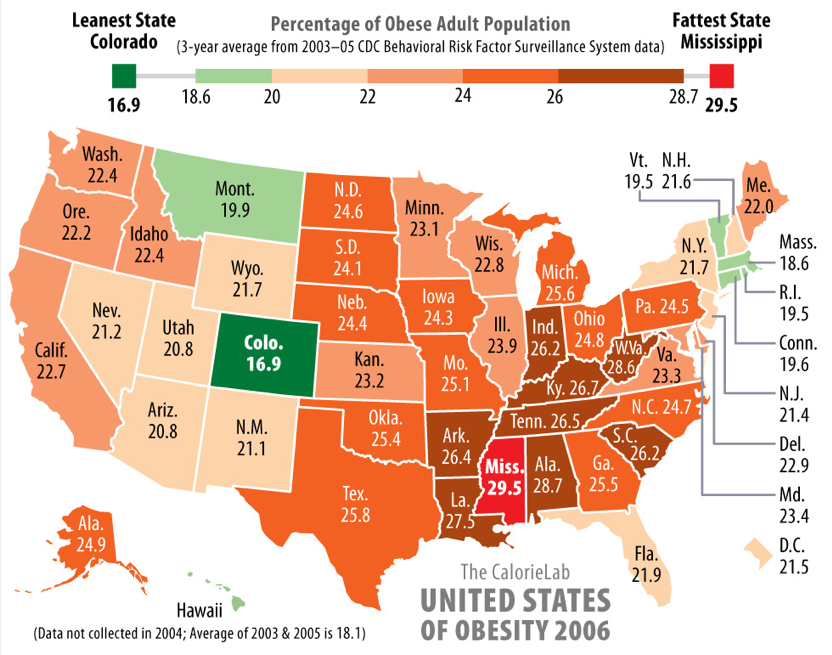
Today our statistically thinnest state has a 19.1% obesity rate among adults, combined obese and overweight is 55.6%. Our fattest, Mississippi (which was also in the bulging ranks in twenty years ago) has an obesity rate of 33.8%, and a combined rate of 68.6%.
http://www.treehugger.com/files/2010...st-in-2009.php
The lightest blue areas have less than 10% obesity rates, the next two blue shades represent 10-20% obesity rates. This is where we were in 1991, with no state in the US (which reported data, the white areas didn't report) having greater than 20% obesity.
The purple is 20-25% obesity, followed by red at 25-30% and orange at greater than 30%. Note that only one state in the 2007-2009 timeframe, Colorado, is in the blue range.
Today our statistically thinnest state has a 19.1% obesity rate among adults, combined obese and overweight is 55.6%. Our fattest, Mississippi (which was also in the bulging ranks in twenty years ago) has an obesity rate of 33.8%, and a combined rate of 68.6%.
http://www.treehugger.com/files/2010...st-in-2009.php










Comment